


In this article we’ll take a little look into the Nginx Log files, and their different configurations.

Nginx (pronounced Engine X) has become one of the most popular web servers on the internet. This is due to its fast speeds and lightweight deployment. After all as developers; all we want is to use tools that don’t leave much of a footprint on our infrastructure. Furthermore at the same time give us a high degree of performance.
Its ability to scale and handle large traffic volumes has led to it gaining market share. But a key component of the Nginx system is its’ error handling and logging functions.
It provides flexible logging features to capture valuable details and help you understand the behavior of your web server. Nginx offers two different files for logging web server data these are namely the error_log and access_log.
Starting access_log is used for storing information about web client requests, while error_log stores other unexpected or informative messages.
Nginx Log Files: access_log
Let’s take a deeper dive into the access_log files, it gathers all client requests immediately after the request is processed, which enables developers to log which pages users are requesting from the webserver. There is also the added flexibility to specify where you want your logs should be using the command:
access_log path [format [buffer=size] [gzip[=level]] [flush=time] [if=condition]];
access_log off;
You end up with something like this:
http {
     	 ...
     	 ...
     	 access_log  /var/log/nginx/access.log;
    	  ...
   	   …
}
Note:
It is always better to segregate the access logs of all the virtual hosts by recording them in a separate file.
server {
    listen 80;
    server_name domain1.com
    access_log  /var/log/nginx/domain1.access.log;
    ...
    ...
    }

tail -f /var/log/nginx/domain1.access.log
Allows you to view your logs for each domain
Format” allows you to use custom format in your logs by using variables such as number of bytes sent to the client ($bytes_sent) or the request length ($request_length).
Whereas, the “if=condition” parameter provides a powerful way to perform conditional logging, so it only stores log access log messages if a certain condition holds true.
Nginx Log Files: error_log
In Nginx, the error_log file captures all log messages at the error severity level. Which means it’s primarily used for understanding fatal or critical messages to help with troubleshooting. The default location for error_log is logs/error.log. The way Nginx stores error messages is flexible and—along with allowing you to write messages to a file—it also supports sending error_log messages to stderr or the Syslog daemon. If you’re running NGINX open source 1.5.2 or newer, you can also send error_log messages to more than one place at a time by specifying multiple error_log directives on the same configuration level.
The Syntax for error_log forllows the convention:
error_log log_file log_level;Where the log_file gives the path the log is to be stored and the log_level indicates the severity of the logs to be kept.
http {
        ...
        error_log  /var/log/nginx/error_log  crit;
        ...
}
The same convention applies to error_log as it di to access_log where you can specify each to the individual virtual host.
http {
       ...
       ...
       error_log  /var/log/nginx/error_log;
       server {
	        	listen 80;
		        server_name domain1.com;
       		        error_log  /var/log/nginx/domain1.error_log  warn;
                        ...
	   }
       server {
	        	listen 80;
		        server_name domain2.com;
      		        error_log  /var/log/nginx/domain2.error_log  debug;
                        ...
	   }
}
You can also send the error_log directly to Syslog using:
error_log syslog:server=192.168.10.11 debug;Note:
There are varying types of log events that hold corresponding levels of priority and you can configure your webserver to show only the ones that meet a certain level. These levels include:
- emerg: Emergency messages when your system may be unstable.
- alert: Alert messages of serious issues.
- crit: Critical issues that need to be taken care of immediately.
- error: An error has occurred. Something went wrong while processing a page.
- warn: A warning messages to take a deeper look at.
- notice: A few notices that you can ignore.
- info: SImple info that you might wish to know
Monitoring Log files via ELL
A common way to monitor Nginx Logs are via ELK (Elasticsearch, Logstash, and Kibana), so you can collect and analyse them.
We will be using Metricbeat which will collect the data related to connections and client requests. And Filebeats which will collect all the access_logs and the error_logs
I’ll be using this via a mac OSX, so the instructions will be from the Mac distribution, However ts shouldn’t be too different from your current OS.
1:Installing elasticsearch
Both filebeats and Metricbeats depend on Elasticsearch so to download use the followind curl command
curl -L -O https://artifacts.elastic.co/downloads/elasticsearch/elasticsearch-7.1.0-darwin-x86_64.tar.gz 2: Extract the archive
tar -xvf elasticsearch-7.1.0-darwin-x86_64.tar.gz3: Change to the bin directory
cd elasticsearch-7.1.0/bin4: Start our single node cluster
./elasticsearchThe cluster runs on localhost:9200 by default:
Configuring Metricbeat and Filebeat
Lets configure both Beats to start collecting and shipping our data.
1: Download Metricbeat:
curl -L -O https://artifacts.elastic.co/downloads/beats/metricbeat/metricbeat-7.1.0-darwin-x86_64.tar.gz
2: Extract the archive
tar -xvf metricbeat-7.1.0-darwin-x86_64.tar.gz
3: Change directories
cd metricbeat-7.1.0-darwin-x86_64
the metricbeats configuration will be looking for an Elastic search on ports 9200 on the local host by default.
4: Enable Metricbeat modules
./metricbeat modules enable nginx
5: Change and update the file ownership
sudo chown root metricbeat.yml
sudo chown root modules.d/system.yml
sudo chown root modules.d/nginx.yml
6: Enable metricsets
open modules.d/nginx.yml file and enable the stubstatus metricset. To do so uncommenting the following:
#metricsets:
# - stubstatus
This will collects data from the ngx_http_stub_status module on Nginx, this needs to be configured for Metricbeats to work.
You may also change the hosts being monitored here, by default <a href="http://127.0.0.1">http://127.0.0.1</a> is monitored. For host based setups this is all we need.
8: Run Metricbeat
sudo ./metricbeat -e
If you should see some initial output, and every time Metricbeat posts data back to your cluster, you should see more output.
Filebeat
Lets install Filebeat se we can collect logs.
1: Download Filebeat
curl -L -O https://artifacts.elastic.co/downloads/beats/filebeat/filebeat-7.1.0-darwin-x86_64.tar.gz
2: Extract the archive
tar -xvf filebeat-7.1.0-darwin-x86_64.tar.gz
3: Change directories
cd filebeat-7.1.0-darwin-x86_64
4: Enable the NGINX module on Filebeat
./filebeat modules enable nginx
Filebeat will try to determine the logs paths based on your OS, if you would like to change them, you can do that in the modules.d/nginx.yml configuration file.
Access and error logs will be collected by default,
5: Update file ownership
sudo chown root filebeat.yml
sudo chown root modules.d/nginx.yml
sudo chown root module/nginx/access/manifest.yml
sudo chown root module/nginx/error/manifest.yml
7: Run Filebeat
sudo ./filebeat -e
Install Kibana
Now Metricbeat and Filebeat are running and shipping our data, we can use Kibana to view this data
1: Download Kibana
curl -O https://artifacts.elastic.co/downloads/kibana/kibana-7.1.0-darwin-x86_64.tar.gz
2: Extract the archive and change directory
tar -xzf kibana-7.1.0-darwin-x86_64.tar.gz
cd kibana-7.1.0-darwin-x86_64
3: Run Kibana
./bin/kibana
By default Kibana will search for Elasticsearch on http://localhost:9200, and will be running on http://localhost:5601.
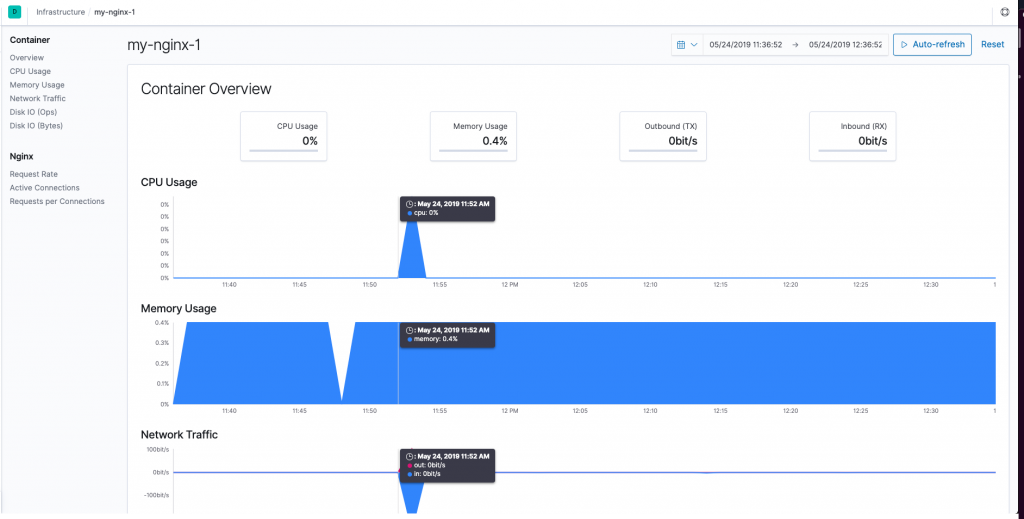
open Kibana at: http://localhsot:5601 — the index will be defined and loaded automatically and the data visible on the Discover page:
Conclusion
Analyzing your Nginx access logs provides you with amazing visibility into the health and activity of your environment. It helps you understand also the operational and business intelligence needed to improve and enhance your product.
Logs area vital tool to a web developer or server admin and being able to quickly access these logs plus configure them to your liking makes Nginx a favorite for developers. The access and error logs in NGINX will not only keep a tab on users’ activity but also save your time and effort in the process of debugging.